Capturing a network packet capture in Windows 11 is very simple. Using the built-in packet capture functionality of Windows 11, this is easy to do.
Run an elevated Windows Terminal window and run this command to begin a packet capture.
PS C:\Users\Intel i5\Desktop> pktmon start --capture Logger Parameters: Logger name: PktMon Logging mode: Circular Log file: C:\Users\Intel i5\Desktop\PktMon.etl Max file size: 512 MB Memory used: 384 MB Collected Data: Packet counters, packet capture Capture Type: All packets Monitored Components: All Packet Filters: None |
This is capturing to the logfile C:\Users\Intel i5\Desktop\PktMon.etl.
And to stop the packet capture, this is how to do it.
PS C:\Users\Intel i5\Desktop> pktmon stop Flushing logs... Merging metadata... Log file: C:\Users\Intel i5\Desktop\PktMon.etl (No events lost) |
This creates a packet capture in a proprietary format, but this may be converted to Wireshark format with the built-in tool.
PS C:\Users\Intel i5\Desktop> pktmon stop Flushing logs... Merging metadata... Log file: C:\Users\Intel i5\Desktop\PktMon.etl (No events lost) PS C:\Users\Intel i5\Desktop> pktmon pcapng PktMon.etl -o pktmon.pcapng Processing... Packets total: 14106 Packet drop count: 277 Packets formatted: 14106 Formatted file: pktmon.pcapng |
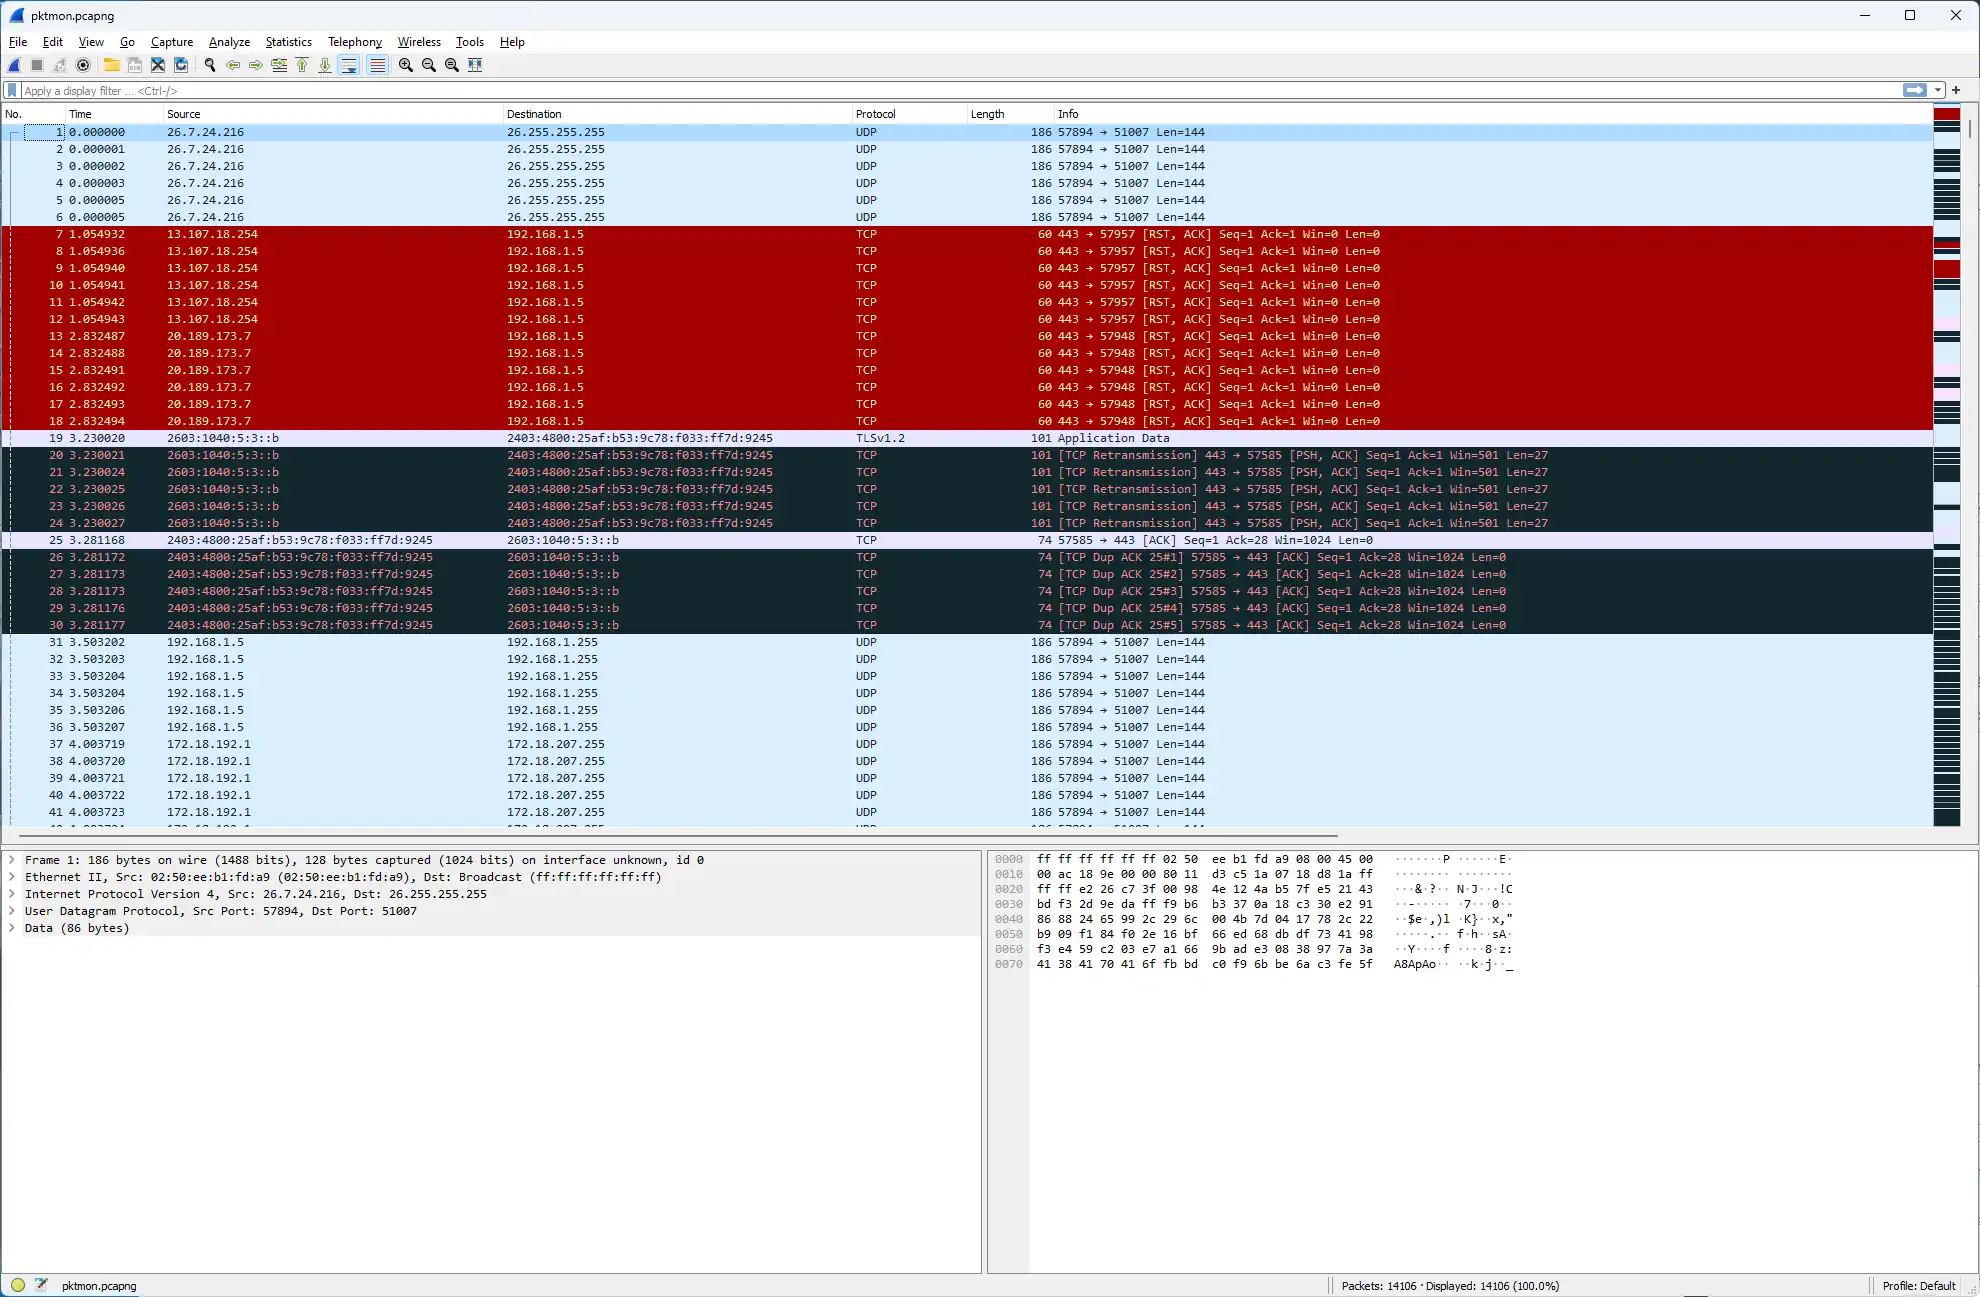
Then it may be opened in Wireshark easily to read the network packets.
This is how easy it is to capture network packets on a PC without Wireshark. This only requires an administrator account to access the elevated Windows Terminal prompt.
To perform a packet capture that only captures Microsoft TCP/IP and NDIS, use this example.
PS C:\Users\Intel i5\Desktop> pktmon start --trace -p Microsoft-Windows-TCPIP -p Microsoft-Windows-NDIS Logger Parameters: Logger name: PktMon Logging mode: Circular Log file: C:\Users\Intel i5\Desktop\PktMon.etl Max file size: 512 MB Memory used: 384 MB Collected Data: Events |
Just ensure that the Terminal window is running as Adminstrator.
PS C:\Users\Intel i5> pktmon filter add -p 20 Failed to add filter: Access is denied. |
To add a filter to monitor FTP traffic using pktmon, use filters like this.
PS C:\Users\Intel i5> pktmon filter add -p 20 Filter added. PS C:\Users\Intel i5> pktmon filter add -p 21 Filter added. |
Then, the packet filters are ready to be used.
Start a packet capture to attempt to grab FTP sessions.
PS C:\Users\Intel i5> pktmon start --etw Logger Parameters: Logger name: PktMon Logging mode: Circular Log file: C:\Users\Intel i5\PktMon.etl Max file size: 512 MB Memory used: 384 MB Collected Data: Packet counters, packet capture Capture Type: All packets Monitored Components: All Packet Filters: # Name Port - ---- ---- 1 <empty> 20 2 <empty> 21 |
And once again, this is how to convert the packet capture to Wireshark format.
PS C:\Users\Intel i5> pktmon pcapng PktMon.etl -o pktmonftp.pcapng Processing... Packets total: 174 Packet drop count: 1 Packets formatted: 174 Formatted file: pktmonftp.pcapng |
This is successful. This is an example packet capture showing the FTP password, as this is not an encrypted session.
0000 c8 14 51 5f a9 47 fc 34 97 a5 bc 7e 08 00 45 00 ..Q_.G.4...~..E. 0010 00 3f 43 fd 40 00 80 06 00 00 c0 a8 01 05 60 f1 .?C.@.........`. 0020 77 75 f8 ee 00 15 85 e7 bb 5f 04 a4 9b 3c 50 18 wu......._...<P. 0030 1f 9c 9a 45 00 00 50 41 53 53 20 6a 6f 68 6e 40 ...E..PASS john@ 0040 65 78 61 6d 70 6c 65 2e 63 6f 6d 0d 0a example.com.. |
This is sending the username.
0000 c8 14 51 5f a9 47 fc 34 97 a5 bc 7e 08 00 45 00 ..Q_.G.4...~..E. 0010 00 38 43 fb 40 00 80 06 00 00 c0 a8 01 05 60 f1 .8C.@.........`. 0020 77 75 f8 ee 00 15 85 e7 bb 4f 04 a4 9b 1a 50 18 wu.......O....P. 0030 1f be 9a 3e 00 00 55 53 45 52 20 41 6e 6f 6e 79 ...>..USER Anony 0040 6d 6f 75 73 0d 0a mous.. |