The new gdu utility is able to show the files in a directory that are using the most disk space. This is one very useful utility. A fast way to see disk space hogs on a Linux system.
Download this file easily and then copy the binary into /usr/local/bin. Direct link: https://github.com/dundee/gdu/releases/latest/download/gdu_linux_amd64.tgz.
(jcartwright@localhost) 192.168.1.5 ~ $ curl -L https://github.com/dundee/gdu/releases/latest/download/gdu_linux_amd64.tgz | tar xz |
Easily get help on the gdu options.
(jcartwright@localhost) 192.168.1.5 ~ $ gdu -h Pretty fast disk usage analyzer written in Go. Gdu is intended primarily for SSD disks where it can fully utilize parallel processing. However HDDs work as well, but the performance gain is not so huge. Usage: gdu [directory_to_scan] [flags] Flags: --config-file string Read config from file (default is $HOME/.gdu.yaml) -g, --const-gc Enable memory garbage collection during analysis with constant level set by GOGC --enable-profiling Enable collection of profiling data and provide it on http://localhost:6060/debug/pprof/ -L, --follow-symlinks Follow symlinks for files, i.e. show the size of the file to which symlink points to (symlinks to directories are not followed) -h, --help help for gdu -i, --ignore-dirs strings Absolute paths to ignore (separated by comma) (default [/proc,/dev,/sys,/run]) -I, --ignore-dirs-pattern strings Absolute path patterns to ignore (separated by comma) -X, --ignore-from string Read absolute path patterns to ignore from file -f, --input-file string Import analysis from JSON file -l, --log-file string Path to a logfile (default "/dev/null") -m, --max-cores int Set max cores that GDU will use. 12 cores available (default 12) -c, --no-color Do not use colorized output -x, --no-cross Do not cross filesystem boundaries -H, --no-hidden Ignore hidden directories (beginning with dot) --no-mouse Do not use mouse --no-prefix Show sizes as raw numbers without any prefixes (SI or binary) in non-interactive mode -p, --no-progress Do not show progress in non-interactive mode -n, --non-interactive Do not run in interactive mode -o, --output-file string Export all info into file as JSON -a, --show-apparent-size Show apparent size -d, --show-disks Show all mounted disks -B, --show-relative-size Show relative size --si Show sizes with decimal SI prefixes (kB, MB, GB) instead of binary prefixes (KiB, MiB, GiB) -s, --summarize Show only a total in non-interactive mode -v, --version Print version --write-config Write current configuration to file (default is $HOME/.gdu.yaml) |
This can also be run in non-interactive mode.
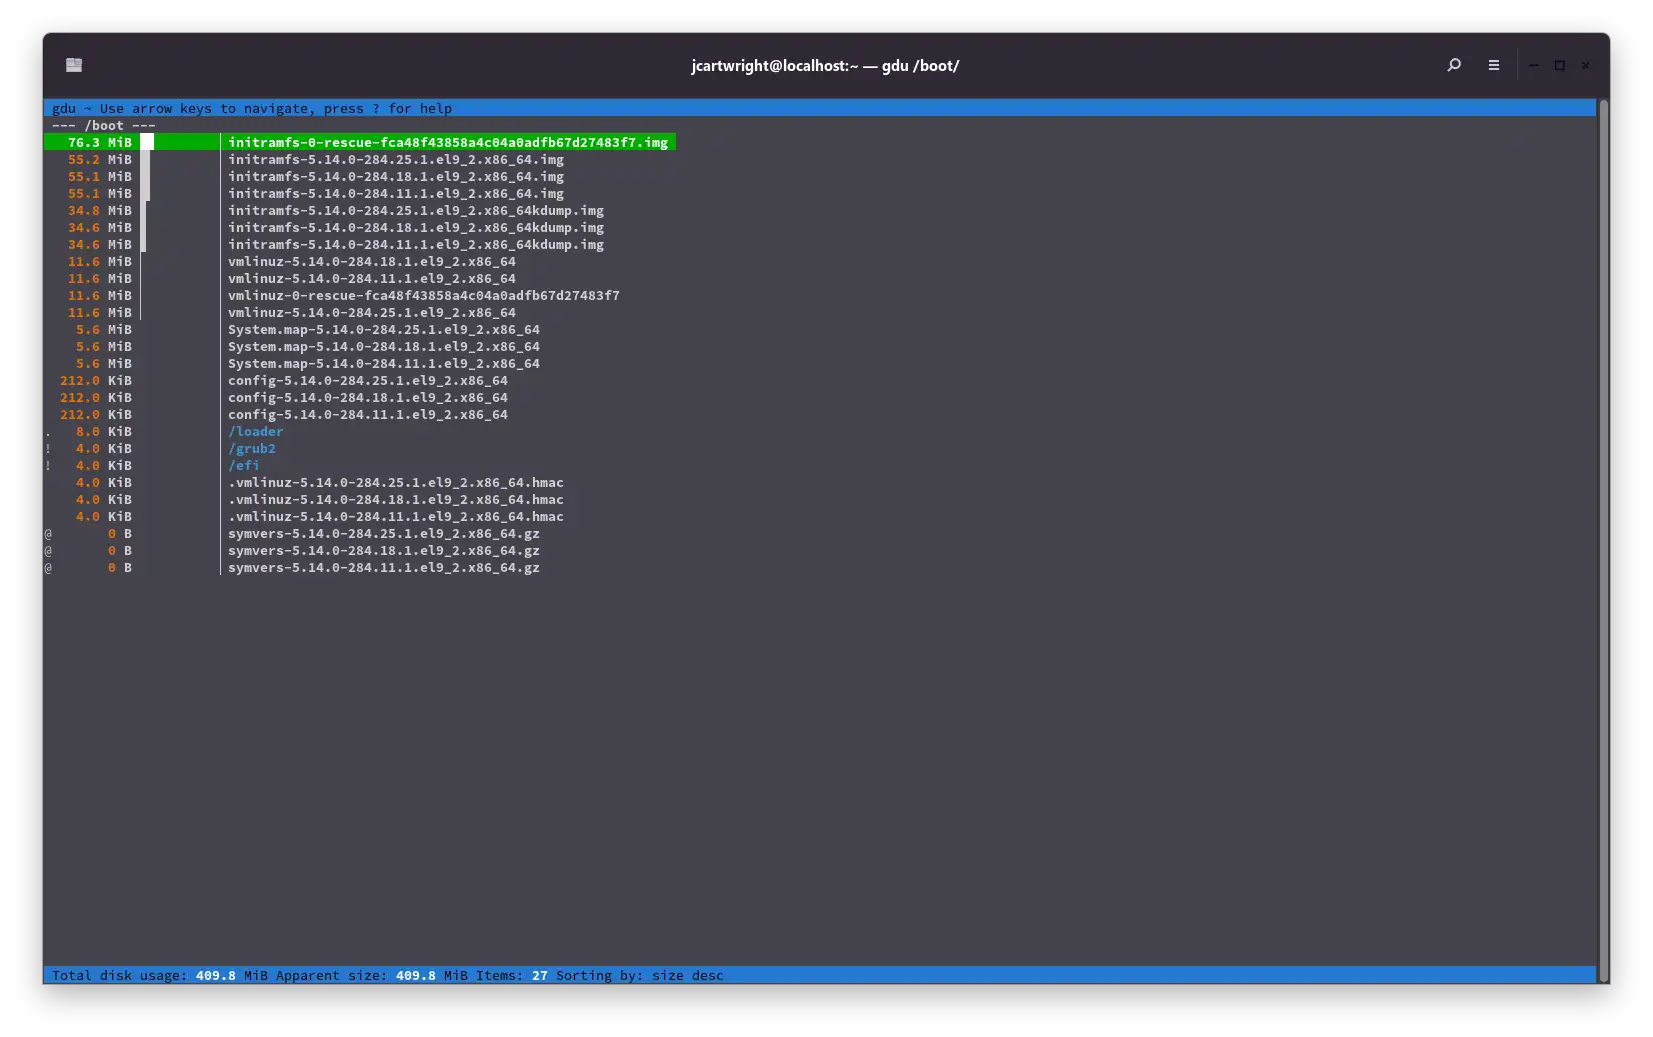
(jcartwright@localhost) 192.168.1.5 ~  $ gdu -n /boot
   76.3 MiB initramfs-0-rescue-fca48f43858a4c04a0adfb67d27483f7.img
   55.2 MiB initramfs-5.14.0-284.25.1.el9_2.x86_64.img
   55.1 MiB initramfs-5.14.0-284.18.1.el9_2.x86_64.img
   55.1 MiB initramfs-5.14.0-284.11.1.el9_2.x86_64.img
   34.8 MiB initramfs-5.14.0-284.25.1.el9_2.x86_64kdump.img
   34.6 MiB initramfs-5.14.0-284.18.1.el9_2.x86_64kdump.img
   34.6 MiB initramfs-5.14.0-284.11.1.el9_2.x86_64kdump.img
   11.6 MiB vmlinuz-5.14.0-284.18.1.el9_2.x86_64
   11.6 MiB vmlinuz-5.14.0-284.11.1.el9_2.x86_64
   11.6 MiB vmlinuz-0-rescue-fca48f43858a4c04a0adfb67d27483f7
   11.6 MiB vmlinuz-5.14.0-284.25.1.el9_2.x86_64
    5.6 MiB System.map-5.14.0-284.25.1.el9_2.x86_64
    5.6 MiB System.map-5.14.0-284.18.1.el9_2.x86_64
    5.6 MiB System.map-5.14.0-284.11.1.el9_2.x86_64
  212.0 KiB config-5.14.0-284.25.1.el9_2.x86_64
  212.0 KiB config-5.14.0-284.18.1.el9_2.x86_64
  212.0 KiB config-5.14.0-284.11.1.el9_2.x86_64
.   8.0 KiB /loader
!   4.0 KiB /grub2
!   4.0 KiB /efi
    4.0 KiB .vmlinuz-5.14.0-284.25.1.el9_2.x86_64.hmac
    4.0 KiB .vmlinuz-5.14.0-284.18.1.el9_2.x86_64.hmac
    4.0 KiB .vmlinuz-5.14.0-284.11.1.el9_2.x86_64.hmac
@       0 B symvers-5.14.0-284.25.1.el9_2.x86_64.gz
@       0 B symvers-5.14.0-284.18.1.el9_2.x86_64.gz
@       0 B symvers-5.14.0-284.11.1.el9_2.x86_64.gz
This would be OK to use in a script. A very useful utility for keeping track of disk space usage on your Linux system.